
Navigating Detect & Respond
Verimatrix XTD Detect & Respond provides insights into the risk assessment of protected apps that your users are running on their devices.
Detect & Respond is available to Verimatrix XTD users. If you do not have access, you can upgrade your account through the Platform.
When you protect an app with XTD, it is automatically added to the Detect & Respond service.
Detect & Respond informs you of risky app instance behaviors at a glance and to optionally respond to detected risky events:
- See the health of your system in the status bar
- Filter your risk detections
- Detect risks in Dashboard view
- Respond to risks with Table view
Detect & Respond
On the left sidebar in the XTD menu, select Detect & Respond.
Detect & Respond is your entry point to see the state of all your protected app instances. It allows you to identify devices running your apps that are performing potentially risky activity.
The Detect & Respond display includes:
- Status bar showing the last 30 days' events, event datastream 10 day bar graph, and health rating for last 30 days
- Dashboard/Table selection, Display results time range setting, filter
- Dashboard view or Table view
Status Bar
The status bar shows a summary of the last 30 days' events over all your apps:

Event Datastream
The event datastream is a representative graph of all events of every risk level, including informational, that occurred over the last 30 days.
Health Rating
Health rating is calculated from the number of threat detections and the total number of events over the last 30 days. As the proportion of threats rises, the system is considered less healthy. Health may be Healthy, Medium, or Unhealthy.
The equation is:
Health Rating = 1 - (Detections) / (Detections + Informational Events)
The score ranges from 0 to 1 but is mapped to a scale of 1 to 10 to make it clearer visually. The higher the score, the healthier your instances.
Dashboard/Table Selection
The view includes a graphical view and a detailed table view. The default view is the graphical (Dashboard) view. To switch between these, click the Dashboard View or Table View tab.

Display Results
By default, Detect & Respond shows the results for the last hour, automatically refreshed every minute. You can change these values to the right of the Dashboard and Table tabs, affecting everything on Detect & Respond except for the status bar which always shows the last 30 days.
Filter
The Filter allows selection of a range of values to filter the data on, such as risk level, App ID, country, OS version, or phone manufacturer.
You can see active filters below the view selection bar. From there, you can also remove individual filters or reset all filters.
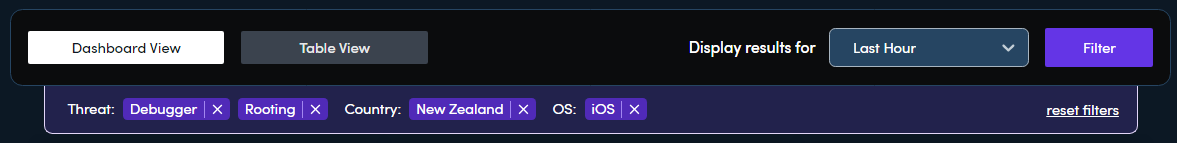
To open the filter popup, click Filter and select from the provided options. The filter affects the entire Detect & Respond screen. You can apply one or more filters simultaneously from both the instance and device characteristic sections.
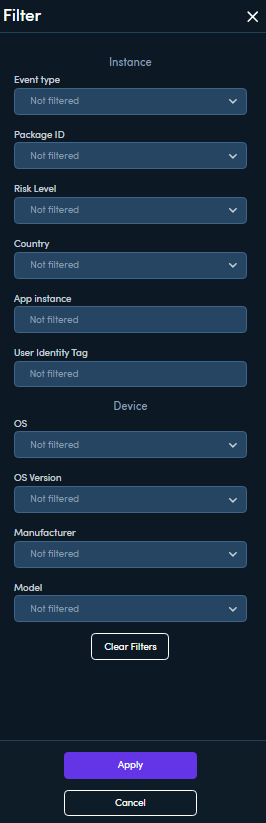
Click Apply to update the dashboard with your selected filters.
Click Clear Filters to set all filters to their default, including the time range and refresh rate. On the main screen, you can clear an individual filter by clicking X next to the filter name.
Filters are either Instance filters or Device filters:
Instance
Set of filters for filtering instance characteristics
Threat - Filters instances by threat detection type. For detailed descriptions of these threats and recommended responses, refer to Risk Detections Quick Guide .
- Rooting - The device has been rooted or jailbroken
- Hooking - Hooking tools which allow insertion of code at run time have been detected
- Tampering - A modification to the protected app's code has been detected
- Debugger - A debugger has been attached to the device running the app instance
- Overlay - GUI elements have been added on top of the app's GUI
- Bootloader Unlock - Custom firmware images can be installed on the device to bypass security
- Accessibility Malware - A specific kind of overlay attack
- Emulator - The protected app is running on an emulator, not a real device
- VPN - A Virtual Private Network is in use on the device
- Proxy - A proxy was detected in the internet connection between the app and the server
- MITM - Man-in-the-Middle attack. Data is being intercepted between the app and the server
Package ID - Filter by instance package ID
App - Filter instances by protected app name
Risk Level - Filter instances by high, suspicious, low, or informational risk
Country - Filter by geographic location of the app instance
App Instance - Filter by the unique identifier of the app installed on a user's device
Device - Filters by reported device characteristics
OS - Filter by OS type (iOS or Android)
OS Version - Filter by exact OS version (for example, iOS 13.0)
Manufacturer - Filter by device manufacturer
Model - Filter by device model
Updated 25 days ago