Getting Started with Dashboard
When you protect an app with Counterspy, it is automatically added to the Dashboard service.
Dashboard informs you of risky app instance behaviors at a glance and to optionally respond to detected risky events:
- See the health of your system in the status bar
- Filter your risk detections
- Detect risky behavior at a glance with Dashboard View
- Single out high-risk app instances and optionally respond with Table View
Dashboard
At the top of the dashboard, both Dashboard View and Table View include the Status Bar, Display Results, and Filter.
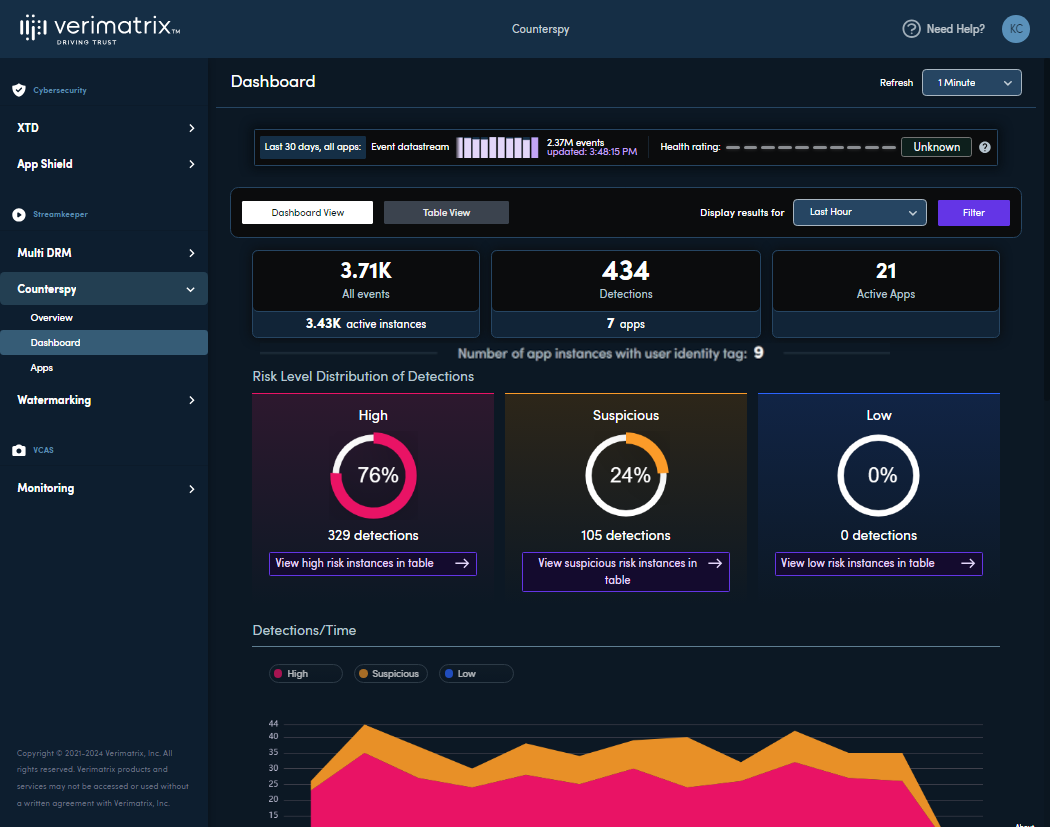
Status Bar

The status bar shows a summary of the last 30 days' events over all your apps:
Event Datastream
The event datastream is a representative graph of all events of every risk level, including informational, that occurred over the last 30 days.
Health Rating
Health rating is calculated from the number of threat detections and the total number of events over the last 30 days. As the proportion of threats rises, the system is considered less healthy. Health may be Healthy, Medium, or Unhealthy.
The equation is:
Health Rating = 1 - (Detections) / (Detections + Informational Events)
The score ranges from 0 to 1 but is mapped to a scale of 1 to 10 to make it clearer visually. The higher the score, the healthier your instances.
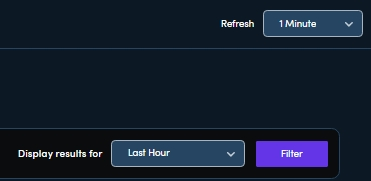
Display Results
By default, the dashboard displays results for the last hour, automatically refreshed every minute. You can change the refresh and time range at the top right of the screen, affecting everything else on the dashboard.
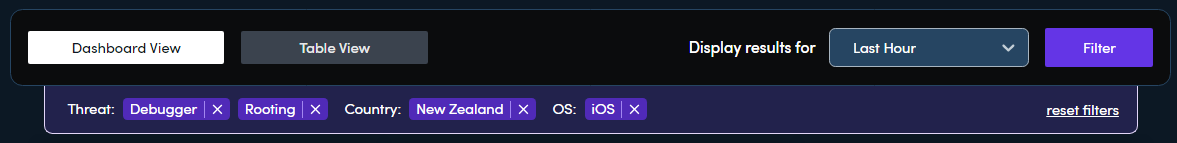
Filter
The Filter allows you to select a range of values to filter the data on fields such as app instance, country, OS version, or device manufacturer.
To open the filter popup, click Filter. The filter affects the entire dashboard. You can apply one or more filters simultaneously.
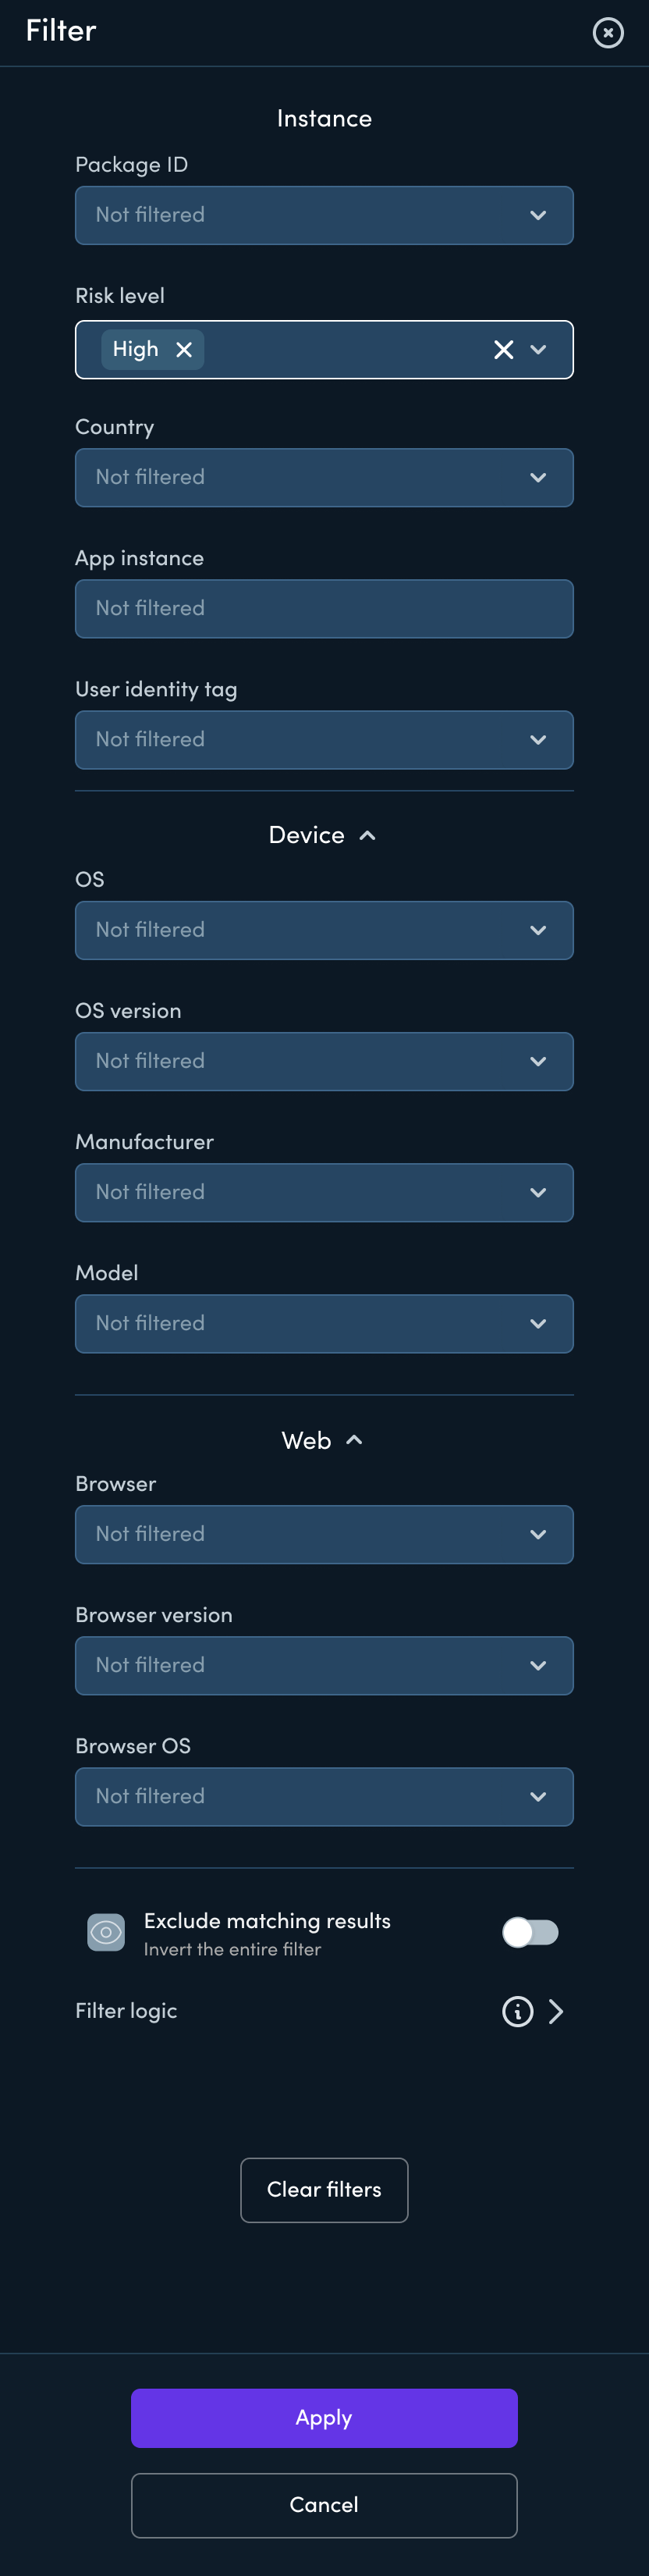
Toggle Exclude matching results to invert the entire filter.
The "Filter logic" dropdown is informational only and describes how your selections will work together as a logical expression.
Click Apply to update the dashboard with your selected filters.
Click Clear Filters to set all filters to their default, including the time range and refresh rate. You can also clear an individual filter by clicking X next to the filter name where it is displayed in the Filters bar.