
OTT Activity Dashboard
The OTT Dashboard provides information on key requests made for over-the-top content from the Verimatrix VCAS system, such as average key request transaction rate, total number of VOD (Video On Demand) and DTV (Digital Television) key requests per minute, and key request latency by sever.
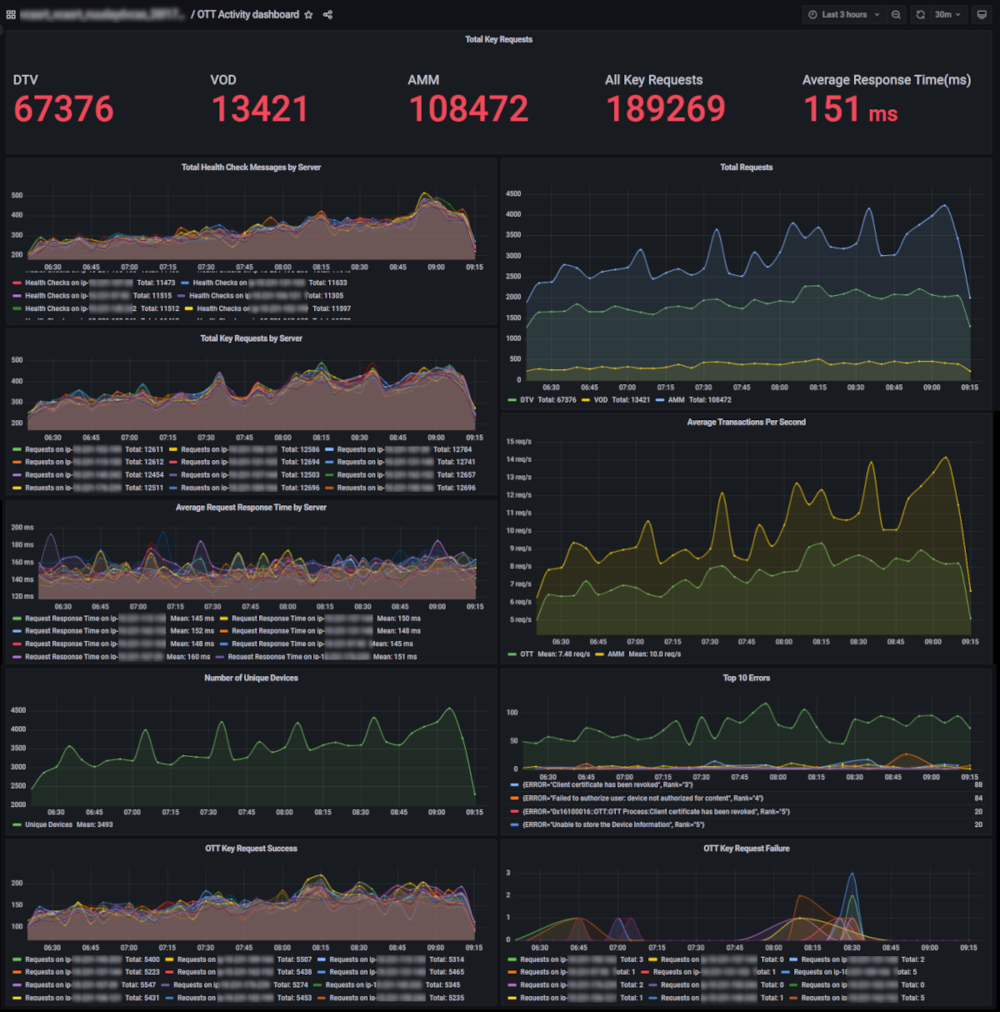
Total Key Requests
- DTV
- VOD
- AMM (Asset Management Message)
- All Key Requests
- Average Response Time (ms)
- Total Health Check Messages by Server
You can find the overall numeric total for each server in the graph legend.
Total Requests
You can find the overall numeric total for each request type in the graph legend.
Total Key Requests by Server
You can find the overall numeric total for each server in the graph legend.
Average Transactions Per Second
Transaction rate per second for DTV, AMM and VOD requests. You can find the overall numeric average (mean) for each request type in the graph legend.
Average Request Response Time by Server
The response time, or latency, is calculated from the time a license request is made to the time the license is successfully received.
Number of Unique Devices
You can find the overall numeric total in the graph legend.
Top 10 Errors
The ten errors that occurred most often during the selected time window. You can find the overall numeric total for each error in the graph legend.
Select an error from the panel legend to isolate that error trend line. Reselect it to show all errors.
OTT Key Request Success
Successful key request count over time per server. You can find the overall numeric total for each server in the graph legend.
OTT Key Request Failure
Failed key request count over time per server. You can find the overall numeric total for each server in the graph legend.