
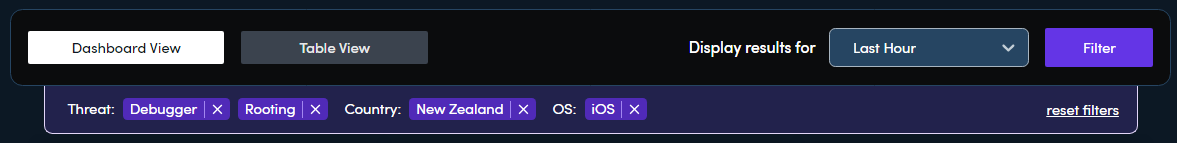
Dashboard View
To select Dashboard view in Counterspy, click the Dashboard View tab.
Summary
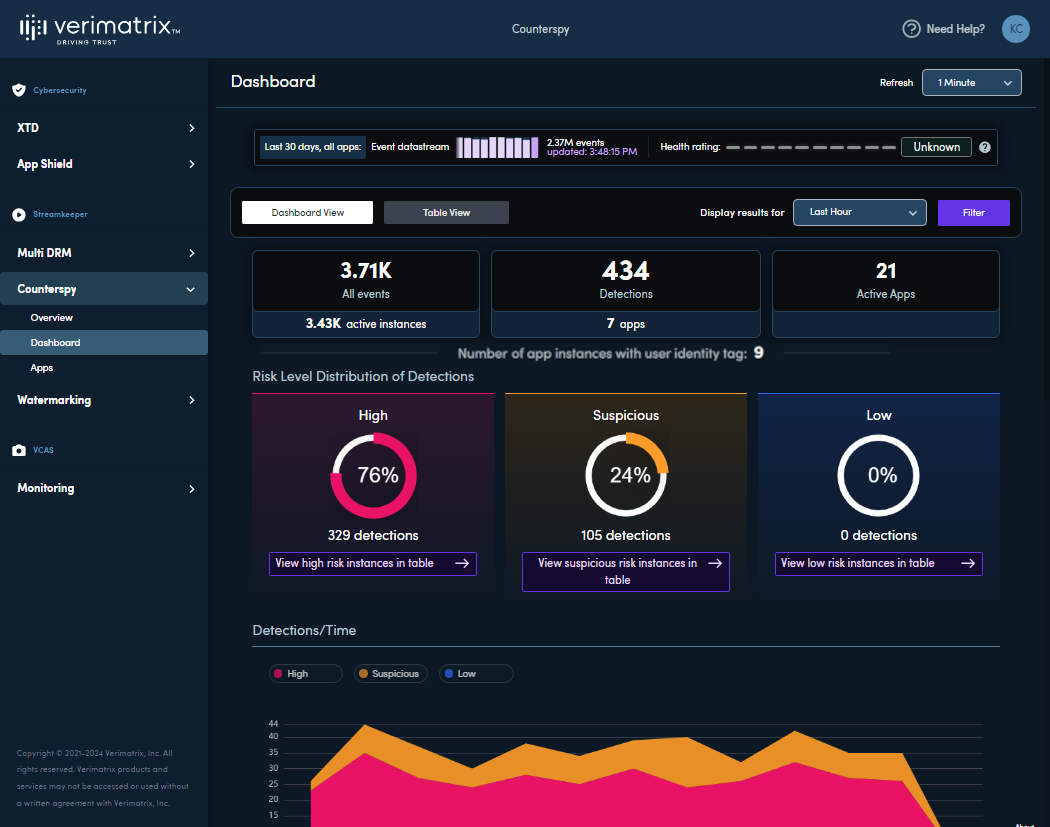
Below the status info, time selection, and filter, the top bar of the dashboard contains at-a-glance indicators of events, risk detections, and apps, filtered by the selected time range and advanced filters.
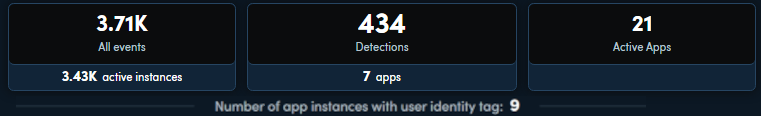
Events
- Events: The total number of events received.
- Active instances: The total number of active instances of active apps.
Detections
- Detections: The total number of risky detections reported.
- Apps: The total number of apps which reported risky detections.
Apps
- Active apps: The number of apps with instances that were active in the selective time range.
App Instances with User Identity Tag
- If an app instance has a user identity tag, its subscriber identifier is known to the service provider. All other app instances are anonymous.
Risk Level Distribution of Detections
The risk level distribution charts indicate the distribution of total detections per risk level.
Risk level distribution charts display detections of high, suspicious, and low risk levels as a proportion of the total number of detections.
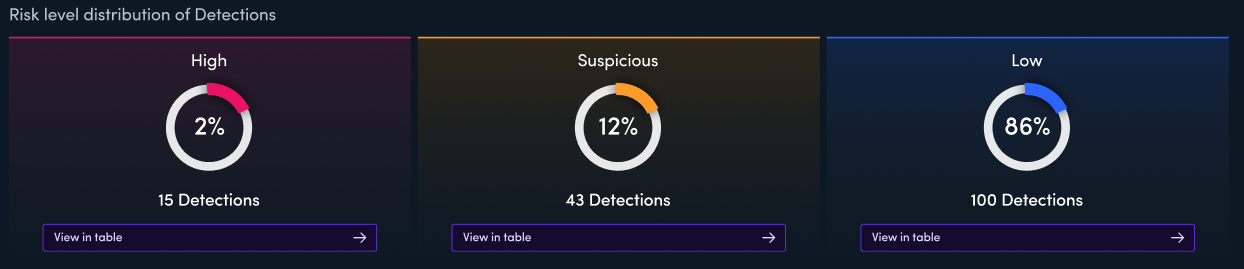
Clicking below a chart takes you to the Table view of the app instances with that risk level.
Detections/Time
The Detections/Time graph givens an indication of when risky events were detected over the displayed time range. Detections are color coded by high, suspicious, and low risk.
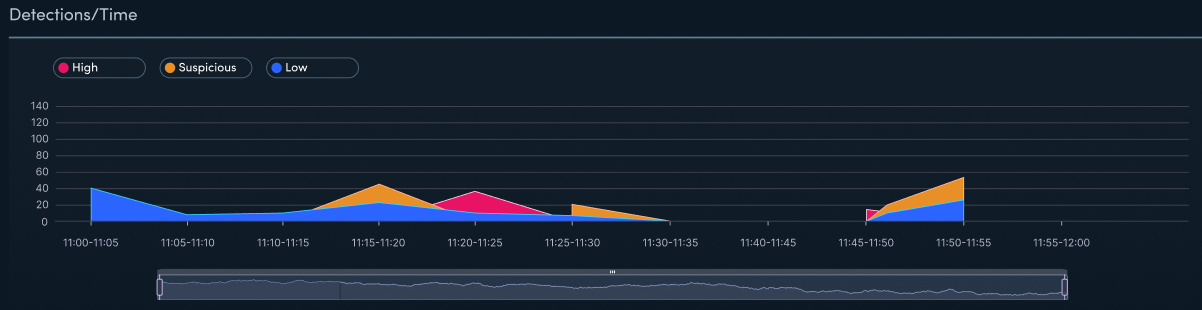
The bar below the graph gives you a quick way to zoom in or out on the time axis using the mouse.
Operating Systems and Devices
The Operating Systems and Devices graph and table displays a breakdown of the devices in your system. Click any part of the visual to filter the entire dashboard to show only that OS or device type.

Detections/Country
The map displays a color-coded representation of the highest-risk detection in each country. Dark gray shaded countries had only informational or no events during the time range.
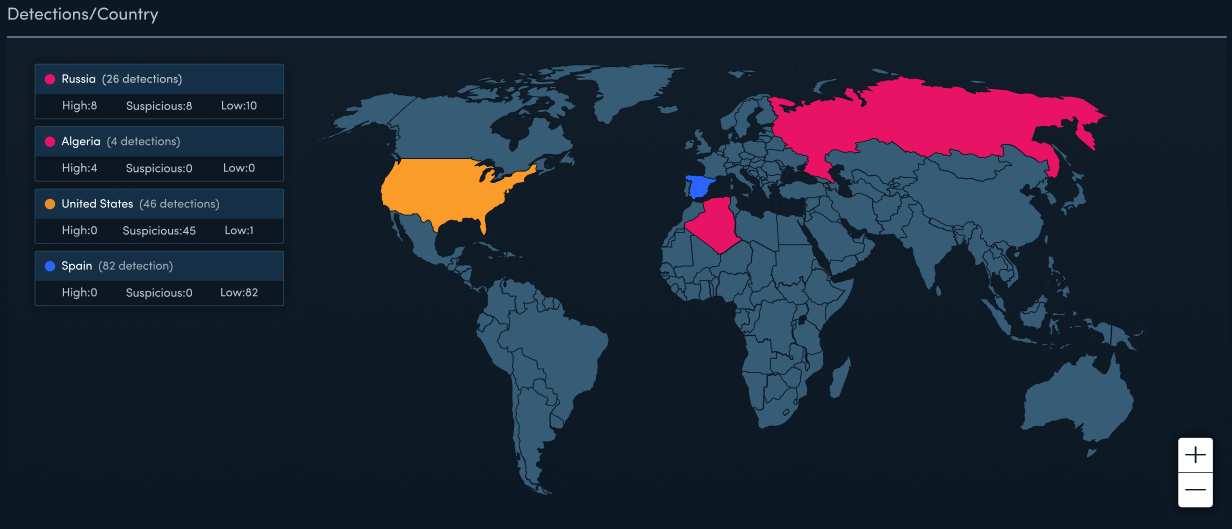
- In the table on the left, hover over a country name to center the map on that country.
- On the map, select a country to filter the entire dashboard to show only that country's data.
You can zoom on the map with the mouse scroll.