
IPTV Activity Dashboard
The VCAS IPTV Activity Dashboard allows you to access and monitor your IPTV data in real time. It provides information on IPTV content key access activity, such as average key request transaction rate and channel key requests.
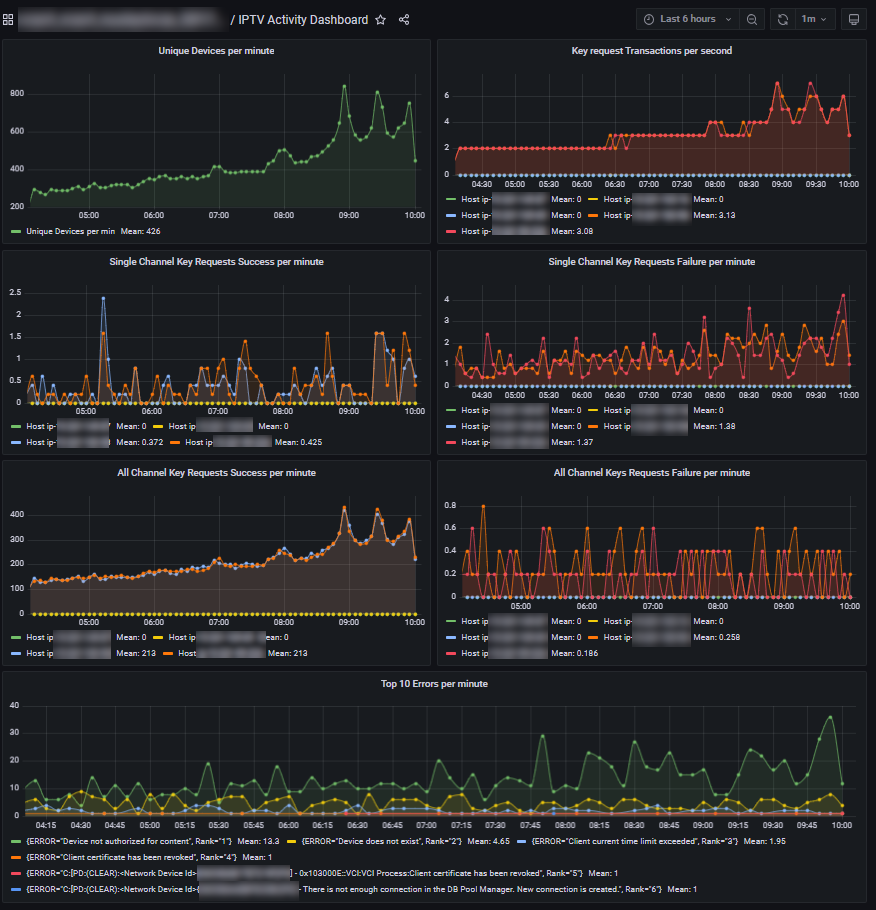
Unique Devices per minute
The number of distinct device IDs that made key requests each minute. The average number of unique devices per minute is displayed in the legend below the graph.
Key Request Transactions per second
Average key request transaction rate per second, measured as latency.
Single Channel Key Requests Success per minute
Total number of times subscribers successfully retrieved a key to a specific content item for which they are entitled.
Single Channel Key Requests Failure per minute
Total number of times subscribers failed to retrieve a requested key to a specific content item for which they are entitled.
All Channel Key Requests Success per minute
Total number of times subscribers successfully requested keys for all of the content in which they are entitled.
All Channel Key Requests Failure per minute
Total number of times subscribers failed to retrieve requested keys for all of the content in which they are entitled.
Top 10 Errors per minute
The ten errors that occurred most often during the selected time window. You can find the overall numeric total for each error in the graph legend. Select an error from the panel legend to isolate that error trend line. Reselect it to show all errors.