
Getting Started
VCAS Monitoring displays your most important VCAS log messages as easy-to-interpret graphs.
After logging into the Verimatrix Platform, access VCAS Monitoring from the screen left navigation bar.
Overview contains a link to every dashboard, or you can select any dashboard directly from the left navigation bar:
- OMI Dashboard
- OTT Dashboard
- IPTV Dashboard
- Multi-DRM Dashboard
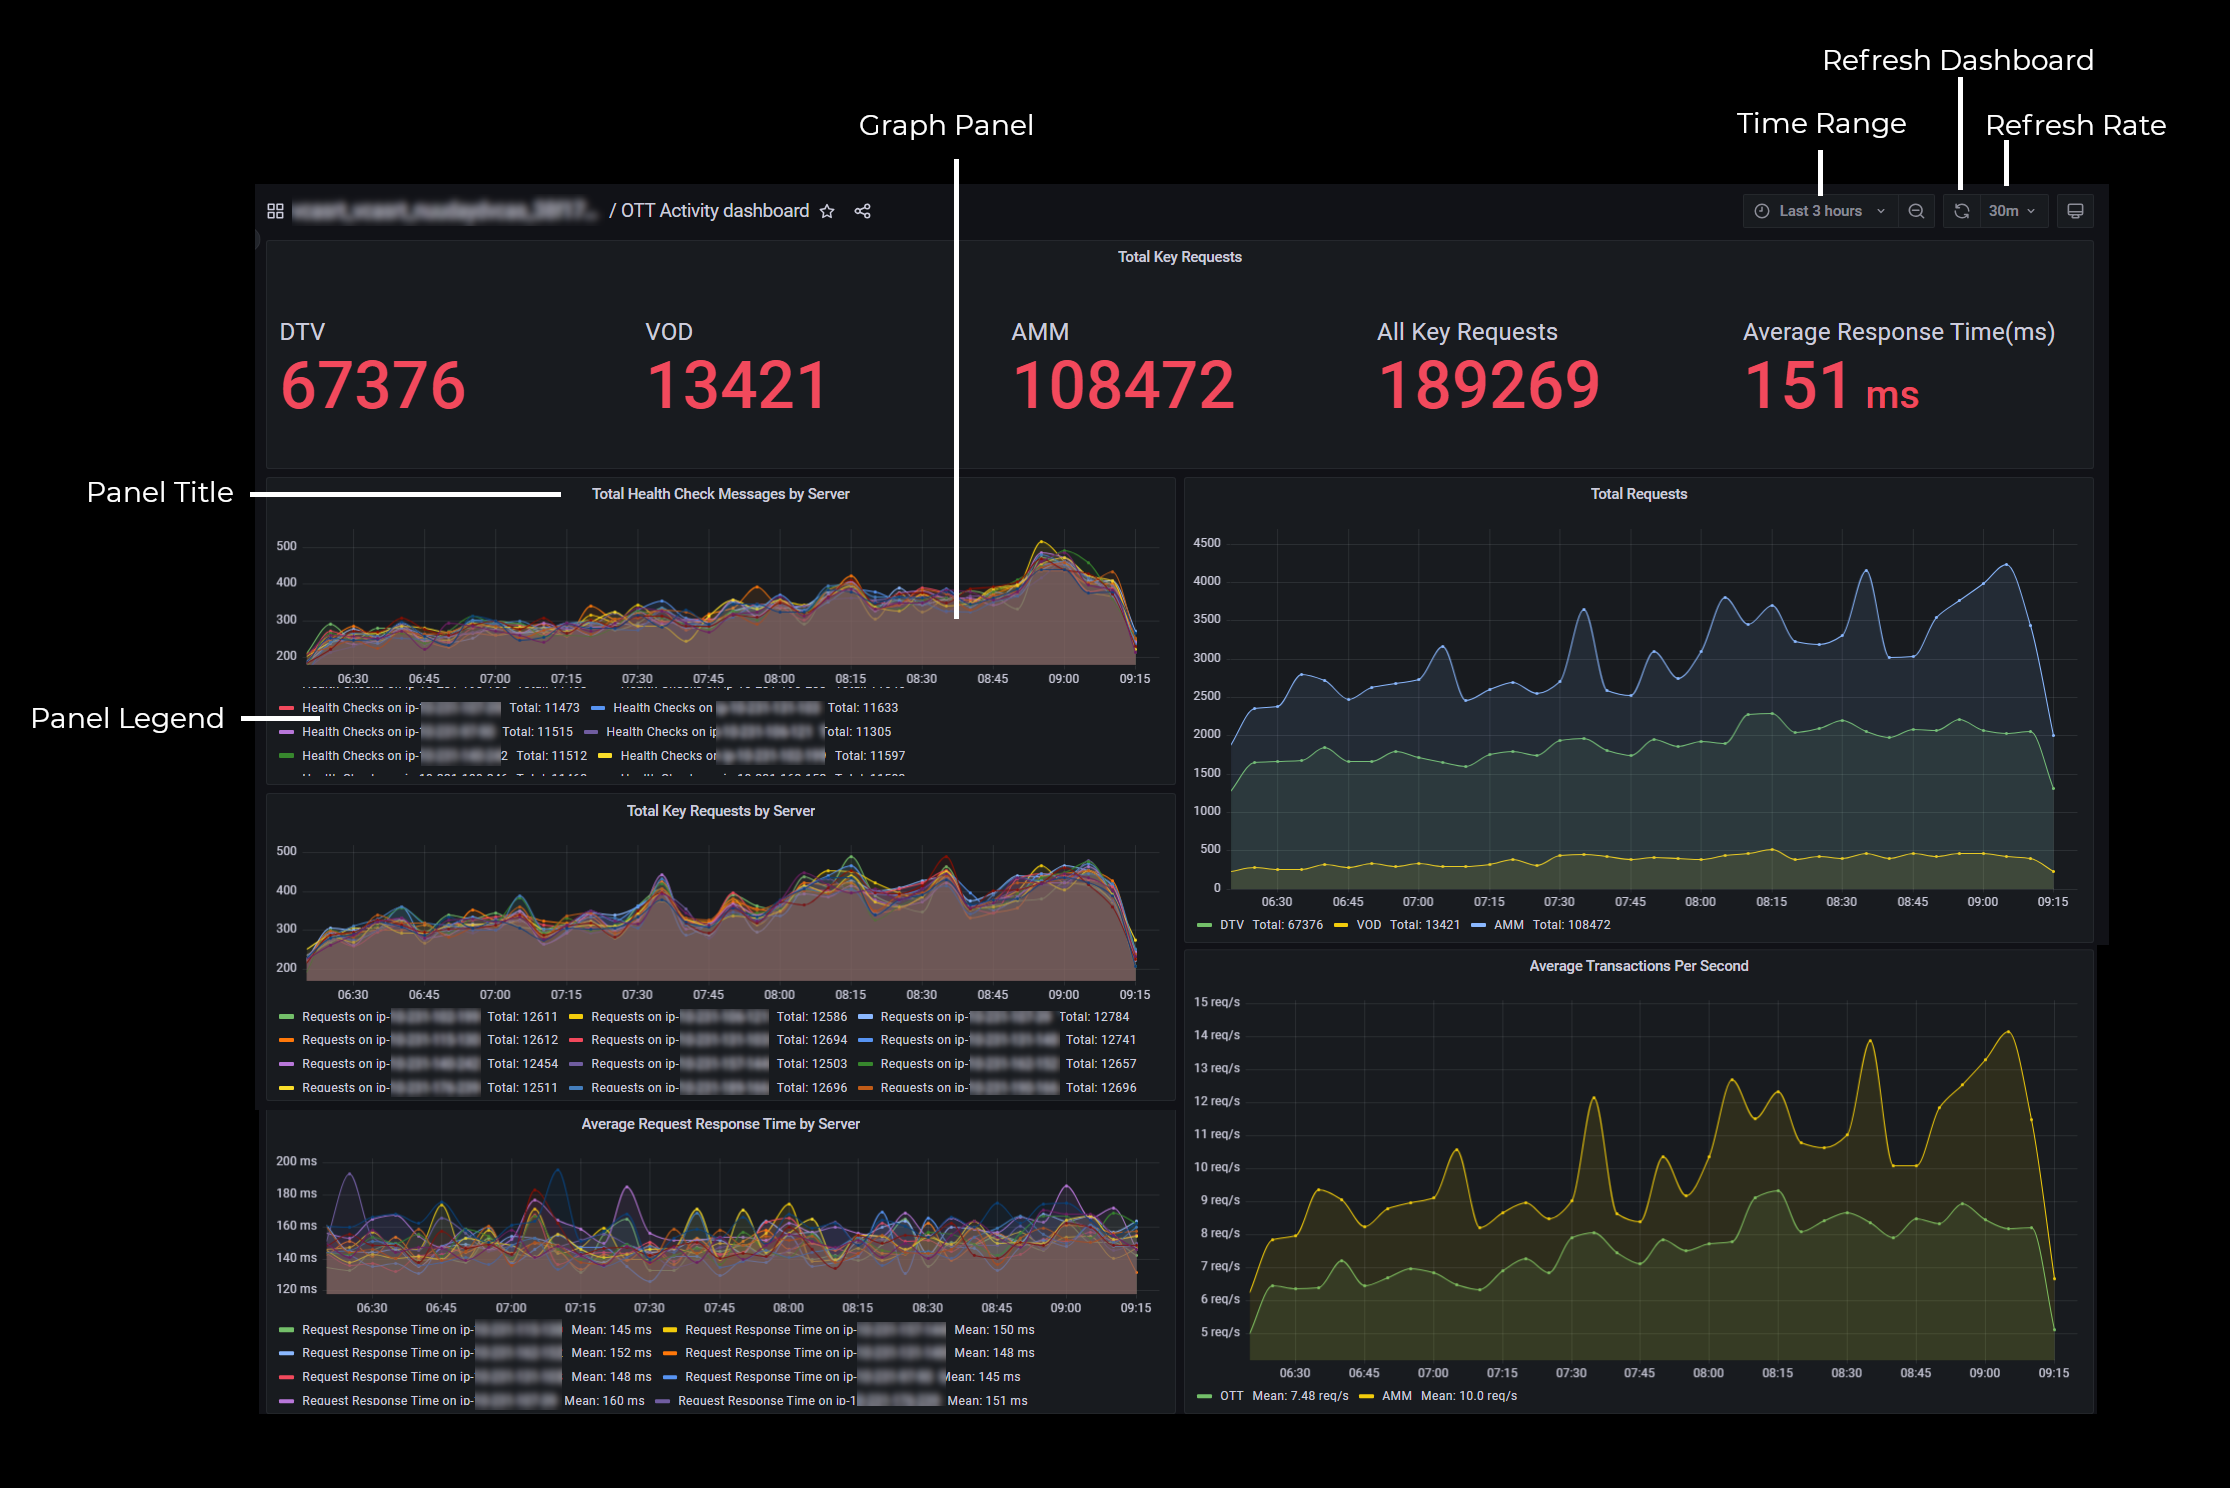
When you first enter the Monitoring screen for your selection, you see a dashboard with graph panels showing the monitored history for the selected time range.
Altering the Dashboard time range
To adjust the time range of all graphs, use the time drop-down at the top right of the screen to select an absolute or relative time range. You can also change the time zone from this drop-down.
To quickly select a subsection of the current time range, use your mouse to drag a box over your selection on a graph panel. All graphs adjust to display the new selection.
To go back to the previous range, press the Back button on your browser.
For more detailed time range controls and examples, such as for semi-relative time ranges, refer to Set dashboard time range on the Grafana help page.
Refreshing the Dashboard
By default, the dashboard is not automatically refreshed.
To refresh the dashboard, click the Refresh dashboard button at the top right of the screen.
Adjust the refresh rate
To adjust the refresh rate, select the new rate from the refresh drop-down to the right of the Refresh dashboard button.
NOTE Your subscription tier might not permit you to select more rapid refresh rates.
Using Graph Panels
Panel menu and shortcuts
Within a graph panel you can select the following commands from the panel title dropdown, or use the associated shortcut keys:
- View full screen (v)
- Share (p s) using a direct link, snapshot, embedded link (panels only), or export link (dashboards only)
- Inspect the panel data, stats, metadata, or JSON (i)
- Hide or show the panel legend (p l)
For a list of all shortcut keys press h.
Display more information
Hover over a data point to see a pop up with more information about the point.
Zoom in on a time range
Drag a box over part of the panel timeline to zoom in on that time subrange. All panels update to the new range. To go back to the previous time range, use your browser's Back button.
Isolate a data line
On the panel legend, select one item to isolate that data line on the graph. Select the item again to redisplay all the data lines.